PyVista
Visualització científica en 3D: malles, núvols de punts acolorits per un valor, i animacions.
Introducció
Matplotlib i Plotly et fan gràfics. PyVista fa una altra cosa: objectes en tres dimensions que giren, amb llum, amb superfícies i amb volum.
És el que necessites quan la teva dada no és una sèrie de números sinó una forma — una peça mecànica, un terreny, una ressonància magnètica, els marcadors d’una captura de moviment.
PyVista és una capa de Python sobre VTK, el motor de visualització científica que hi ha sota programes com ParaView. VTK és de C++ i té vint-i-cinc anys; PyVista és el que el fa suportable.
Dibuixa a la teva màquina, que és el que et deixa moure milions de triangles — i també el que fa que necessiti una targeta gràfica que funcioni. Per a molècules, i sobretot per ensenyar-les a algú altre, py3Dmol dibuixa al navegador i no depèn de res.
Entorn de treball
uv init viz
Initialized project `viz` at `C:\Users\eva\viz`

cd viz
uv add pyvista imageio
Using CPython 3.14.3
Resolved 32 packages in 337ms
Installed 31 packages in 95ms
 + imageio==2.37.4
 + pyvista==0.48.4
imageio només et cal per desar animacions; per mirar coses a la pantalla amb pyvista n’hi ha prou.
Formes
Un Plotter és la finestra. Hi afegeixes malles amb add_mesh i l’obres amb show.
=
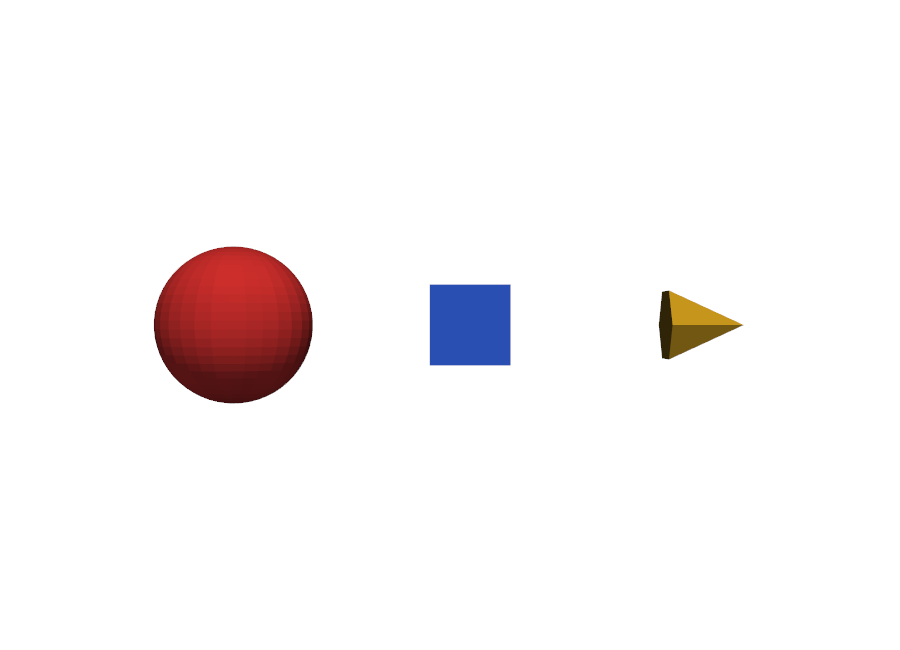
Arrossega el ratolí per girar-ho i la roda per acostar-t’hi.
Fixa’t que no has col·locat cap càmera: show() mira on són les coses i s’hi encara sol.
Un núvol de punts
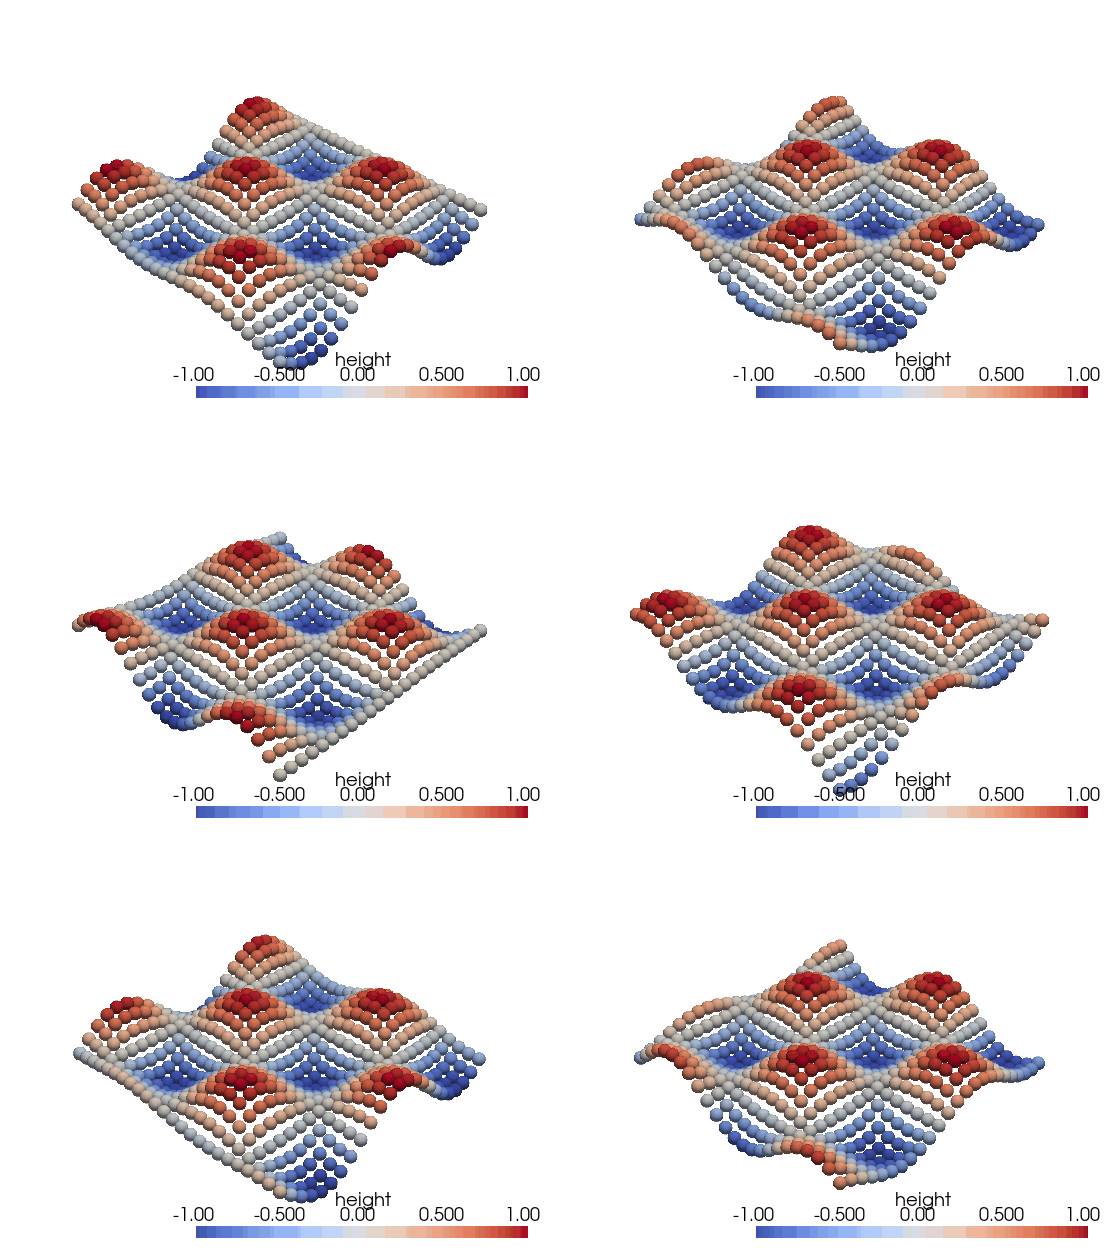
La forma més habitual de dada científica no és una malla sinó una llista de punts, i cada punt amb un valor mesurat.
Un PolyData és això, i glyph hi posa la mateixa figura a cada punt — una esfera, repetida, que VTK dibuixa d’una tirada per moltes que en siguin.
=
=
= * 0.12
= 0.02 *
=
=
=
=
Estàs llegint una vista prèvia.
Inicia sessió amb Google per llegir la pàgina completa.
Inicia sessió amb GoogleAmb qualsevol compte de Google. Només et demanarem que acceptis les condicions del servei.